Inventory Management System Kpis for Manufacturing

Inventory Management System Kpis helps Australian wholesalers and manufacturers manage inventory, orders, and purchasing. Xero integration, customer portals,...

Prefer to talk? Call 1300 980 598
  • Inventory turnover ratio tracking to measure stock movement efficiency and cash conversion speed
  • Days Inventory Outstanding (DIO) calculation showing average days inventory sits before sale
  • Real-time carrying cost analysis including warehousing, insurance, and capital tied-up costs
  • Automated stockout prevention with negative inventory tracking and intelligent PO generation
  • Inventory accuracy monitoring through barcode scanning and cycle counting integration
  • EOFY stocktake management with GST compliance and tax reporting built-in
  • Perfect order rate measurement combining on-time delivery, accuracy, and quality metrics

Understanding inventory management system KPIs is essential for any manufacturing business looking to streamline operations and boost profitability — see also our Inventory Management Software for the full picture. Key Performance Indicators (KPIs) are measurable values that show how effectively your inventory management processes are working. For Australian manufacturers, wholesalers, and distributors, tracking the right KPIs can mean the difference between thriving and merely surviving in a competitive market.

When you're managing stock across multiple locations or dealing with complex supply chains, you need visibility into what's actually happening with your inventory. A Sydney coffee roaster managing seasonal demand spikes, or a Melbourne brewery juggling raw materials and finished goods, can't afford to guess about stock levels. That's where KPIs come in. They transform raw data into actionable insights that help you make smarter purchasing decisions, reduce waste, and ultimately improve your bottom line.

The right inventory management system KPIs give you real-time visibility into stock movements, identify bottlenecks before they become problems, and help you align inventory levels with actual demand. Whether you're tracking turnover rates, stockout frequencies, or carrying costs, these metrics provide the foundation for continuous improvement. In this guide, we'll walk you through the essential KPIs every manufacturing and wholesale business should be monitoring, and how to use them to drive better business outcomes.

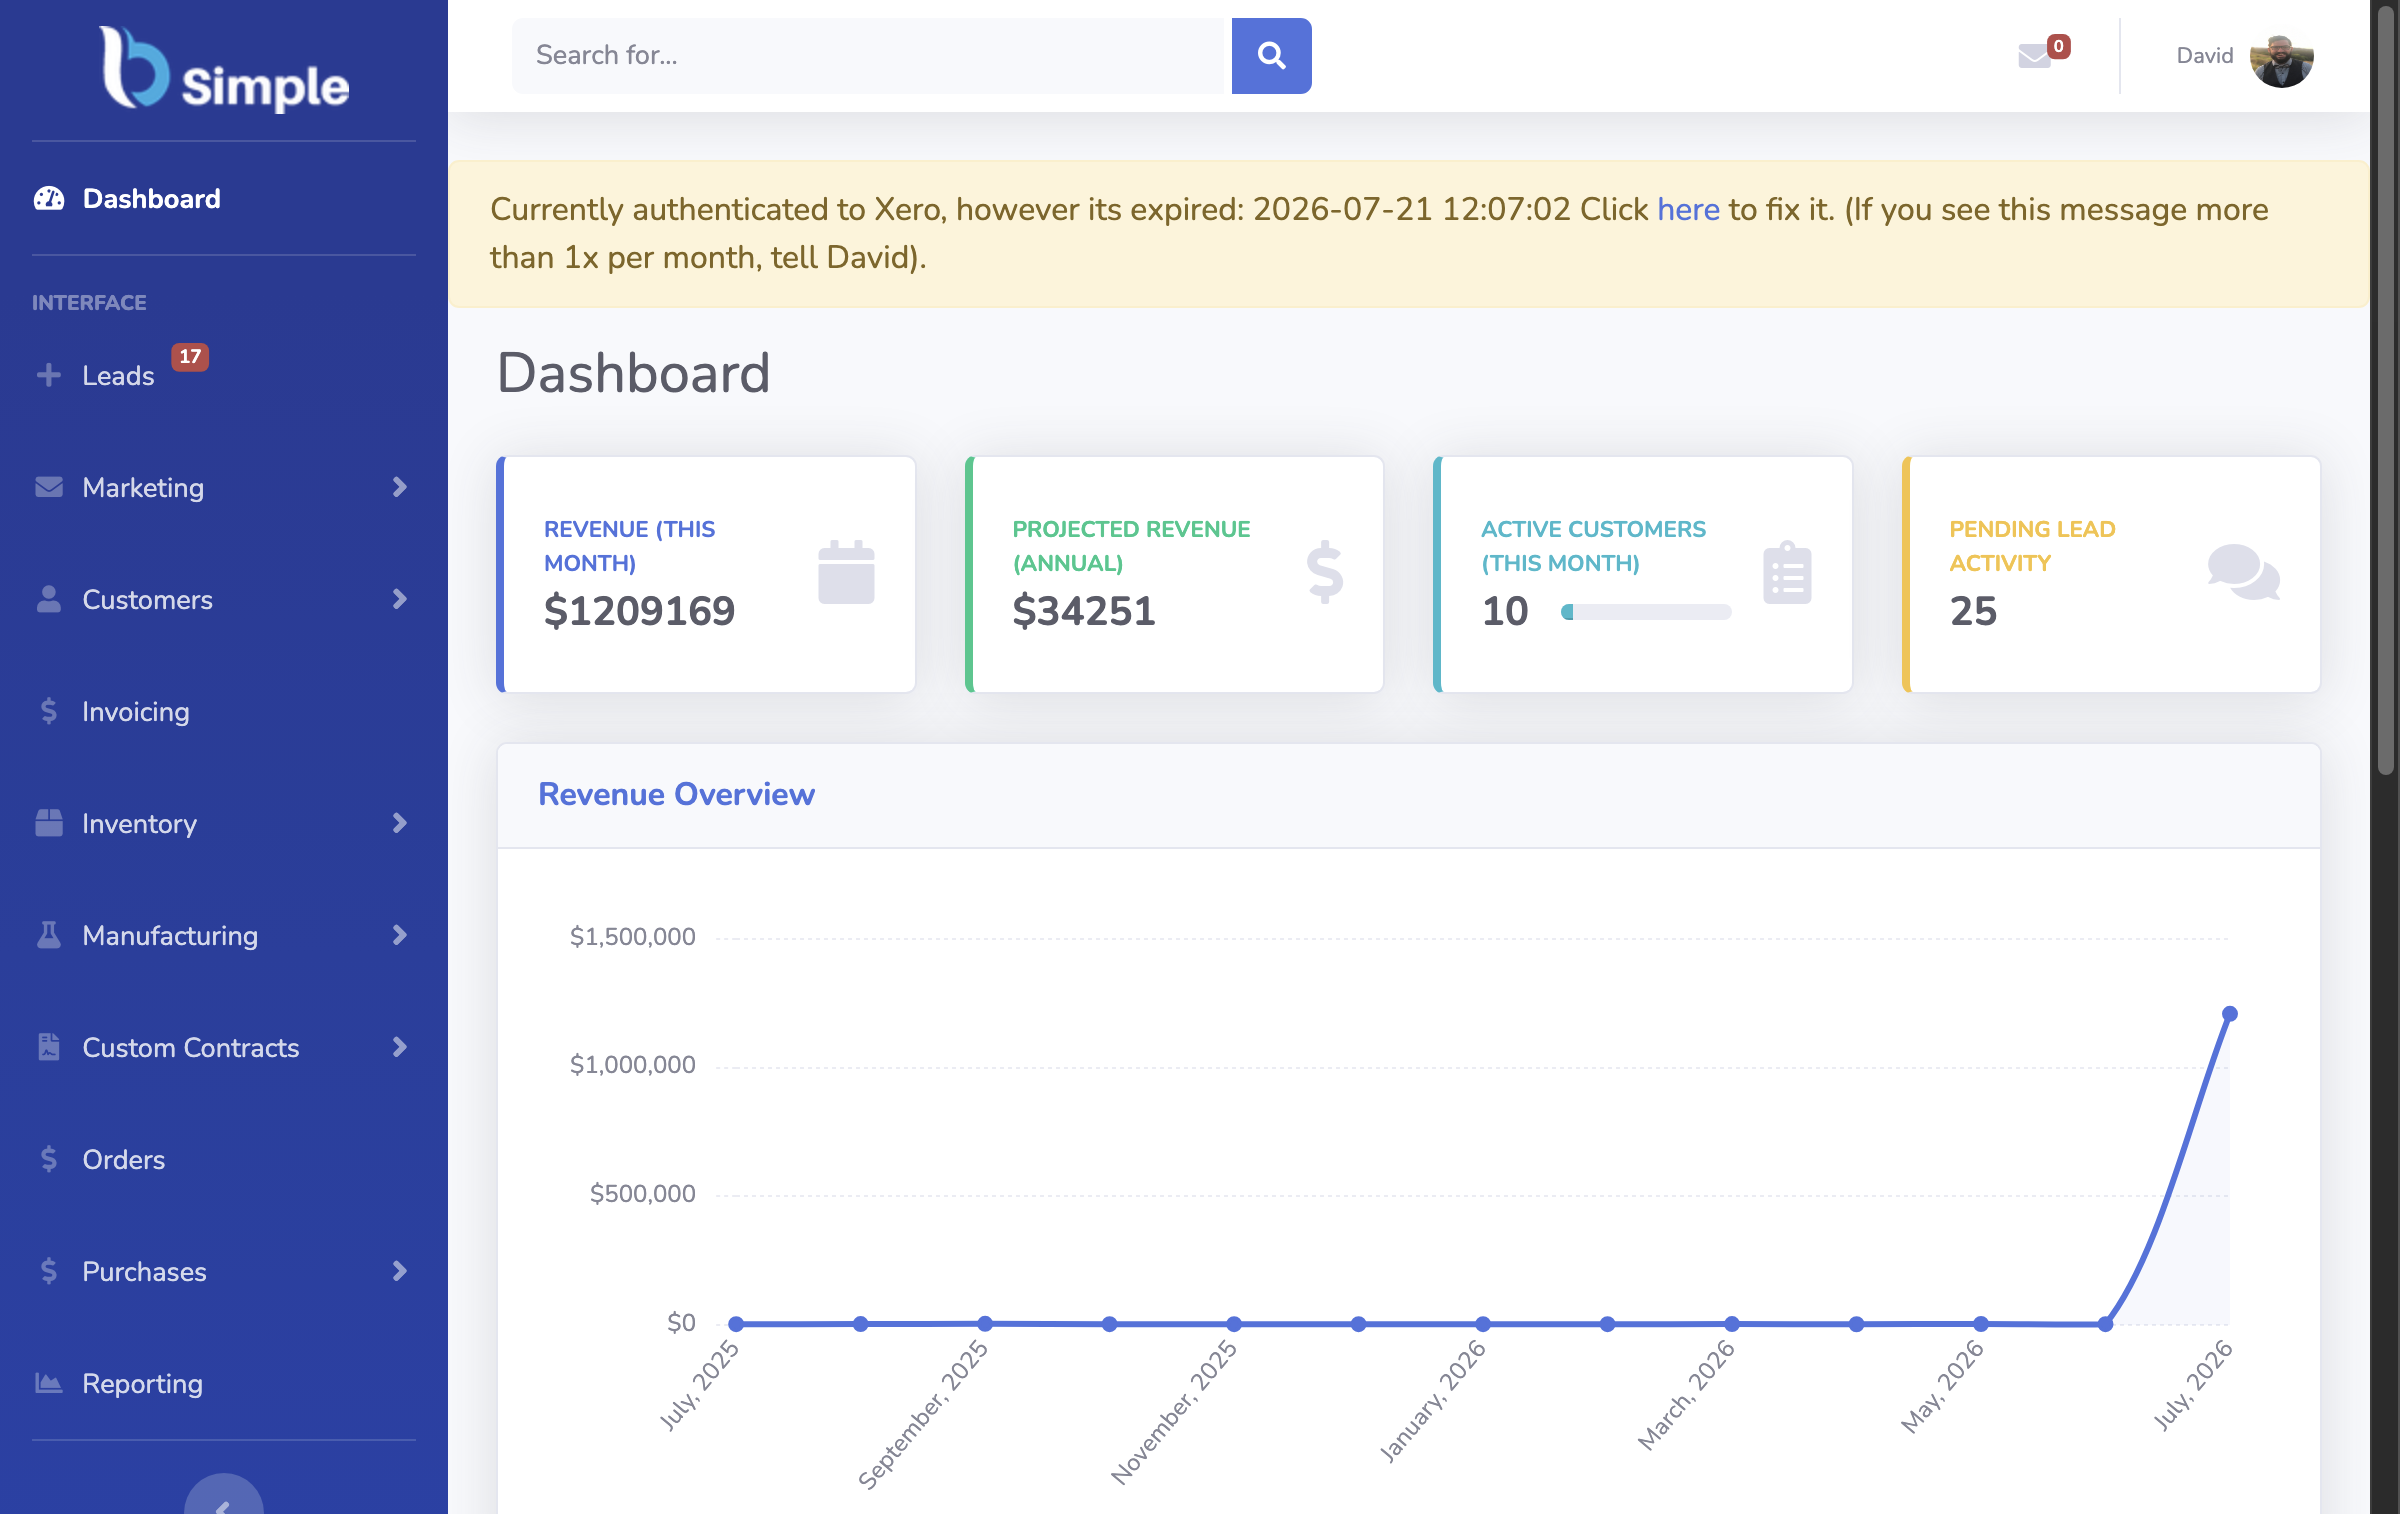
BSimple inventory management dashboard

Essential KPIs Every Manufacturer Should Track

The most critical inventory KPI for any business is inventory turnover ratio, which measures how many times you sell and replace your inventory during a specific period. A higher turnover rate generally indicates healthy demand and efficient inventory management, whilst a lower rate might suggest overstocking or slow-moving products. For a Melbourne brewery, understanding turnover helps identify which beer styles are selling quickly and which are sitting on shelves gathering dust.

Calculating inventory turnover is straightforward: divide your cost of goods sold (COGS) by your average inventory value. If you're moving stock quickly, you're freeing up cash that would otherwise be tied up in inventory. This is particularly important for Australian SMBs operating on tight margins. Conversely, if your turnover is sluggish, you're carrying unnecessary carrying costs — warehousing, insurance, and the risk of obsolescence.

Days Inventory Outstanding (DIO) is closely related and equally important. This KPI tells you how many days, on average, inventory sits in your warehouse before being sold. A lower DIO is generally better because it means you're converting stock to cash more quickly. For manufacturing businesses, understanding DIO helps with cash flow planning, especially around EOFY stocktakes when GST compliance matters.

Another vital metric is stock-out frequency — how often you run out of items customers want to buy. Even one stockout can lose you a sale and damage customer relationships. With inventory management software that tracks negative inventory and automates PO generation, you can prevent stockouts before they happen. This is where just-in-time inventory strategies really shine, allowing you to maintain lower stock levels without sacrificing availability.

Enquire Now

BSimple inventory control software

Carrying Costs and Inventory Holding Efficiency

Carrying costs represent the total expense of holding inventory, including warehousing, insurance, utilities, and the cost of capital tied up in stock. For many Australian distributors, carrying costs can represent 20-30% of inventory value annually. This is why monitoring carrying cost as a percentage of inventory value is crucial for profitability.

Calculate this by dividing total annual carrying costs by your average inventory value, then multiply by 100 for a percentage. If your carrying costs are running at 25% and your average inventory is worth $100,000, you're spending $25,000 annually just to hold that stock. That's a significant expense that directly impacts your bottom line. By reducing inventory levels through better demand forecasting and faster turnover, you can dramatically reduce these costs.

Inventory accuracy is another KPI that shouldn't be overlooked. This measures how closely your system records match your physical stock. A 95% accuracy rate might sound good, but that 5% discrepancy can cause serious problems — missed customer orders, unexpected stockouts, and wasted time investigating variances. Regular stocktakes, particularly important for Australian businesses managing EOFY requirements, help maintain accuracy. Modern inventory systems with barcode scanning and automated tracking can push accuracy towards 99%.

Obsolescence rate is the percentage of inventory that becomes unusable or unsaleable. This might be due to damage, expiration dates, or simply falling out of fashion. Manufacturing businesses particularly need to watch this metric, as raw materials with limited shelf lives or finished goods in declining demand can quickly become write-offs. Tracking obsolescence helps you adjust purchasing patterns and avoid repeating costly mistakes.

More features

BSimple order management interface

Lead Time and Demand Forecasting Metrics

Purchase lead time — the time between placing an order and receiving goods — is a critical KPI that directly affects your ability to meet customer demand. If your supplier takes 8 weeks to deliver, but customer demand changes weekly, you're constantly chasing your tail. Understanding and optimising lead times helps you plan inventory levels more accurately and reduce the need for safety stock.

Demand forecasting accuracy is equally important. This measures how closely your predicted demand matches actual demand. Poor forecasting leads to either excess inventory or stockouts — both expensive problems. By tracking this metric over time, you can refine your forecasting methods and adjust your safety stock levels accordingly. For seasonal businesses like that Sydney coffee roaster dealing with summer iced coffee surges, accurate forecasting is the difference between capturing sales and being caught short.

Perfect order rate measures the percentage of orders fulfilled completely, on time, and in perfect condition. This KPI directly impacts customer satisfaction and repeat business. A perfect order rate below 95% suggests problems in your picking, packing, or quality control processes. Many Australian wholesalers use customer ordering portals integrated with their inventory systems to improve order accuracy and speed up fulfillment.

Return rate is another telling metric — the percentage of products returned by customers. High return rates indicate quality issues, incorrect orders, or customer dissatisfaction. Tracking returns by product, customer, or reason helps you identify systemic problems. For manufacturing businesses, understanding what's being returned helps improve production quality and reduce waste.

Create a free account

BSimple purchase order workflow

Cash Flow and Inventory Valuation Metrics

For a closer look at how these capabilities fit together, our warehouse management software guide ties it all together, and the guide to kenya walks through the practical details. Inventory to sales ratio measures how much inventory you're holding relative to your sales volume. A ratio of 1:3 means you're holding inventory worth one-third of your monthly sales — a reasonable benchmark for most wholesale and manufacturing businesses. If your ratio is climbing, it suggests inventory is accumulating faster than it's selling, tying up cash you could use elsewhere.

Gross margin return on investment (GMROI) is a powerful metric that combines profitability with inventory turnover. It shows how much profit you're making for every dollar of inventory invested. A GMROI of 3:1 means you're earning $3 in gross margin for every $1 of inventory. This metric helps you identify which products are truly profitable when you account for the cost of holding them.

Inventory write-off rate measures the value of inventory lost to damage, theft, or obsolescence as a percentage of total inventory value. Most businesses aim for less than 2%. If your write-off rate is higher, it's worth investigating the causes — are your storage conditions inadequate? Is security an issue? Are you ordering products that don't sell? With integrated order management software and proper inventory controls, you can significantly reduce write-offs.

Lastly, inventory turnover by category helps you understand which product lines are performing well and which are dragging down your overall metrics. A Melbourne brewery might find their core range turns over 12 times annually, whilst limited edition brews turn over only twice. This insight helps inform product development, purchasing decisions, and marketing strategies. By monitoring these KPIs consistently and using them to drive decision-making, you'll build a leaner, more profitable inventory operation that actually supports your business growth rather than hindering it.

Learn more

BSimple stocktake and inventory tracking

Frequently Asked Questions

What is the ideal inventory turnover ratio for manufacturing businesses?

Ideal turnover varies by industry, but most manufacturers aim for 4-8 times annually. Fast-moving consumer goods might target 12+, whilst capital equipment might be 1-2. Track your specific industry benchmarks and improve from there.

How often should we conduct physical stocktakes?

Australian businesses should conduct full stocktakes at EOFY for GST compliance and tax purposes. Many also do quarterly or cycle counts to maintain accuracy. Modern systems enable continuous counting without disrupting operations.

What's a good inventory accuracy percentage?

Aim for 95% minimum, ideally 98-99%. Accuracy directly impacts customer satisfaction and operational efficiency. Regular cycle counts and barcode scanning help achieve high accuracy consistently.

How does Xero integration help with inventory KPI tracking?

Xero integration provides real-time financial data that feeds into inventory KPI calculations. You can track carrying costs, COGS, and profitability metrics automatically, eliminating manual data entry and improving accuracy.

What's the difference between DIO and inventory turnover?

Inventory turnover shows how many times stock is replaced annually, whilst Days Inventory Outstanding (DIO) shows how many days inventory sits before selling. They measure the same efficiency from different angles — use both for complete visibility.

How can just-in-time inventory reduce carrying costs?

Just-in-time ordering means receiving stock precisely when needed, minimising storage time and carrying costs. This requires reliable suppliers and accurate demand forecasting, but can reduce carrying costs by 20-30% for suitable products.

Why is perfect order rate important for wholesale businesses?

Perfect order rate directly impacts customer retention and profitability. Customers who receive complete, accurate orders on time are more likely to reorder. Missing items or delays damage relationships and increase returns, reducing your bottom line.