
Guide / visibility
Inventory management software dashboard
A dashboard is only as honest as the record feeding it. What the tiles should actually show for a wholesale or distribution operation — and how to tell a dashboard that informs from one that decorates.
The key facts
- The tiles that earn their place: stock value and movement, low-stock and reorder lists, order states needing action, purchasing on order, and exceptions since yesterday.
- The rule: a dashboard is a view of the record, never the record itself — pretty tiles over an untrustworthy ledger decorate the drift.
- The action test: every tile should answer "does something need doing?" — dashboards that only report history are reports, not cockpits.
- BSimple's take: an operations dashboard showing order, invoice and stock values, backed by the live record — visible in the trial on your own data.
- 01The key facts
- 02What the dashboard should actually show
- 03The record underneath decides everything
- 04BSimple's dashboard, described honestly
What the dashboard should actually show
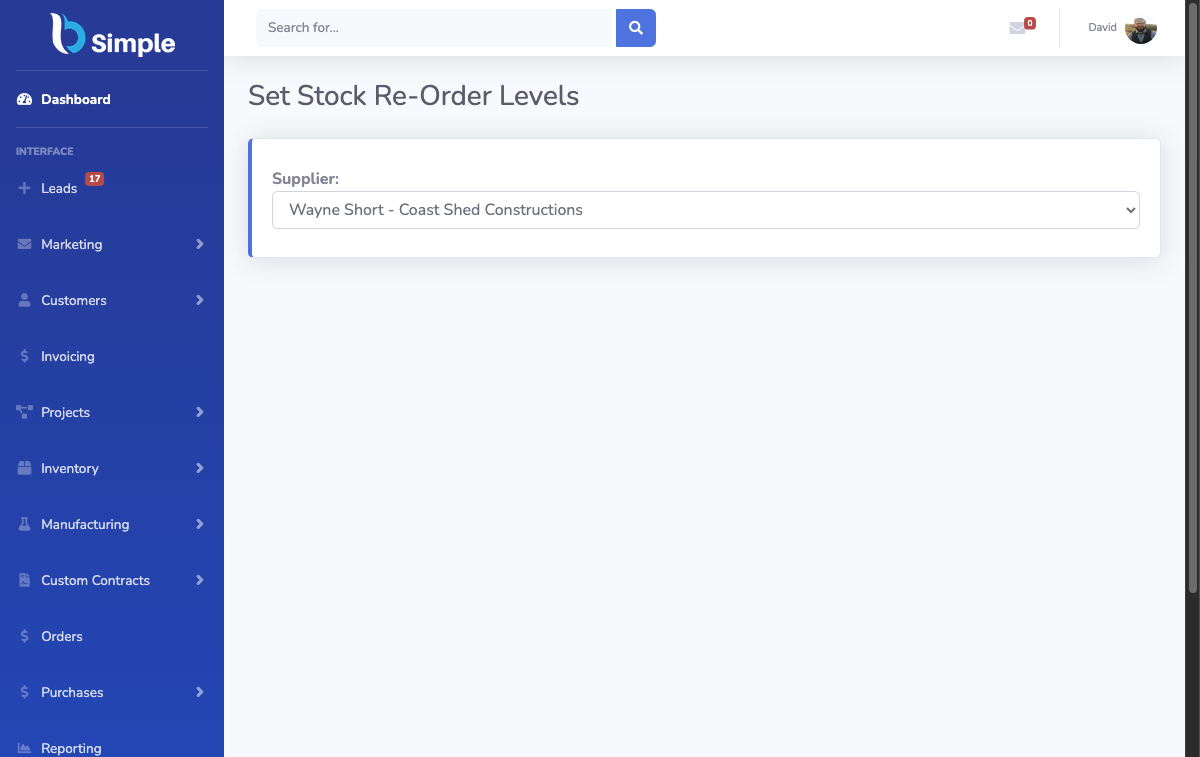
Stock value and its movement — what the inventory is worth and whether it is growing or shrinking, because cash tied to shelves is the number owners feel. Low-stock and reorder lists — not a chart, a worklist: what to buy, against which supplier, before it runs out. Order states needing action — received and unvalidated, allocated and unpicked, packed and uninvoiced; each is a person's next task, and the dashboard should count them plainly. Purchasing on order — what is inbound, from whom, and whether it is late. Exceptions since yesterday — variances flagged, price variances held, negative-stock guardrails tripped.
What deserves no tile: vanity charts of data nobody acts on. The test is the morning question — "what needs doing?" — and every tile should answer part of it, or make space for one that does.
The record underneath decides everything
The dashboard's reliability is inherited, not manufactured: it renders whatever the record says. If stock on hand is derived from an append-only movement history, the tiles are trustworthy at any hour; if the record is typed over by hand, the most beautiful dashboard is a lie with good formatting. That is why the record design matters more than any visual choice — and why a demo dashboard showing seeded, clean data proves nothing about yours.
The practical check: query one tile's number against physical reality. Pick a product from the low-stock list, count the shelf, and see whether the dashboard was reporting the truth or a version of it. The benefits page covers what changes operationally when the answer is reliably yes, and the KPIs worth tracking decide what the tiles should be.
BSimple's dashboard, described honestly
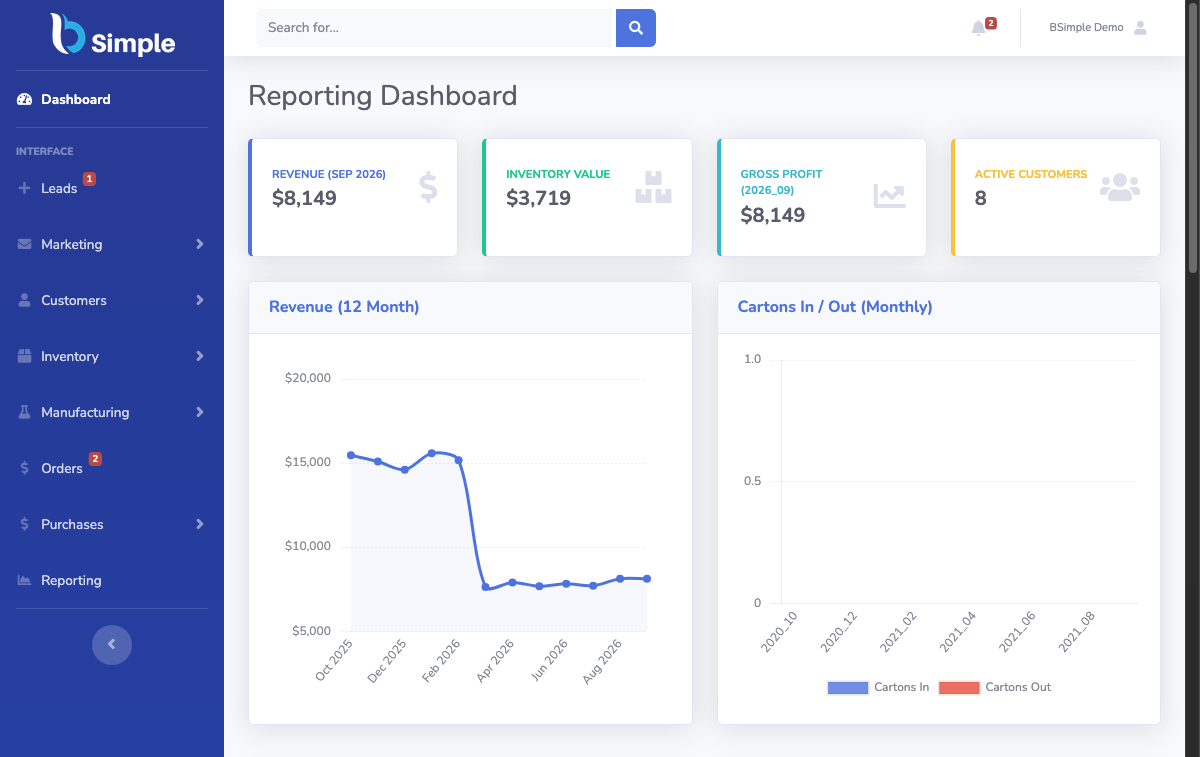
We build BSimple, so weigh that: its operations dashboard shows order, invoice and stock values on one screen, backed by the same record the warehouse and portals write to — live quantities by location, order states through pick-and-pack to invoicing, purchasing signals from reorder levels, and the reporting views (including mass-balance and traceability) for the deeper questions. Nothing on it is a separate calculation that can drift from the record, because nothing on it is calculated twice.
The honest limits: it is an operations cockpit, not a business-intelligence suite — deep slicing and cross-source analytics belong in exports and the reporting tools your accountant prefers, fed by the record's data and the public API if you build on it. From $180/month AUD, with the trial showing the dashboard populated with your own products — the only version of a dashboard worth judging.
Frequently Asked Questions
What should an inventory dashboard show?
Stock value and movement, low-stock worklists, order states needing action, inbound purchasing, and since-yesterday exceptions. Actionable tiles over vanity charts — each tile answers part of "what needs doing today?"
Why do dashboards lie?
They inherit whatever the record holds: typed-over stock totals, unrecorded movements, silent edits produce confident-looking tiles that disagree with the shelf. The dashboard is a view; the record is the truth it can only reflect.
How is a dashboard different from a report?
A report looks back for analysis; a dashboard looks at now for action — current states, pending exceptions, and the worklists that drive the next hour. Most businesses need one good dashboard and a handful of deep reports, not twenty of each.
Does BSimple include a dashboard in every plan?
Yes — the operations dashboard is part of the core product at $180/$250/$399 AUD monthly, populated from the live record. The trial shows it running on your own products before any commitment.
Can I build my own dashboard from the data?
Yes — exports cover the analyst's seat, and the public REST API (read projections for reorder levels, stocktakes, purchase orders, suppliers, locations) lets you build live views on the real record. The automation overview maps the surface.

BSimple