Guide / data science
Inventory management system on Kaggle
Kaggle is a data-science platform — datasets, notebooks and competitions — not inventory software. Where it genuinely helps an inventory project (analysis, forecasting practice, teaching), where it cannot help (running stock), and what serious analysts learn from it.
The key facts
- Kaggle is not an inventory system. It hosts datasets, notebooks and competitions for data science practice — nothing there records a stock movement or an order.
- Where it helps: learning analysis on supply-chain datasets, practising demand-forecasting techniques, and teaching the discipline of clean historical data.
- Where it ends: a model is not a record. Running stock needs movements, audit trails and guardrails — operational software, not notebooks.
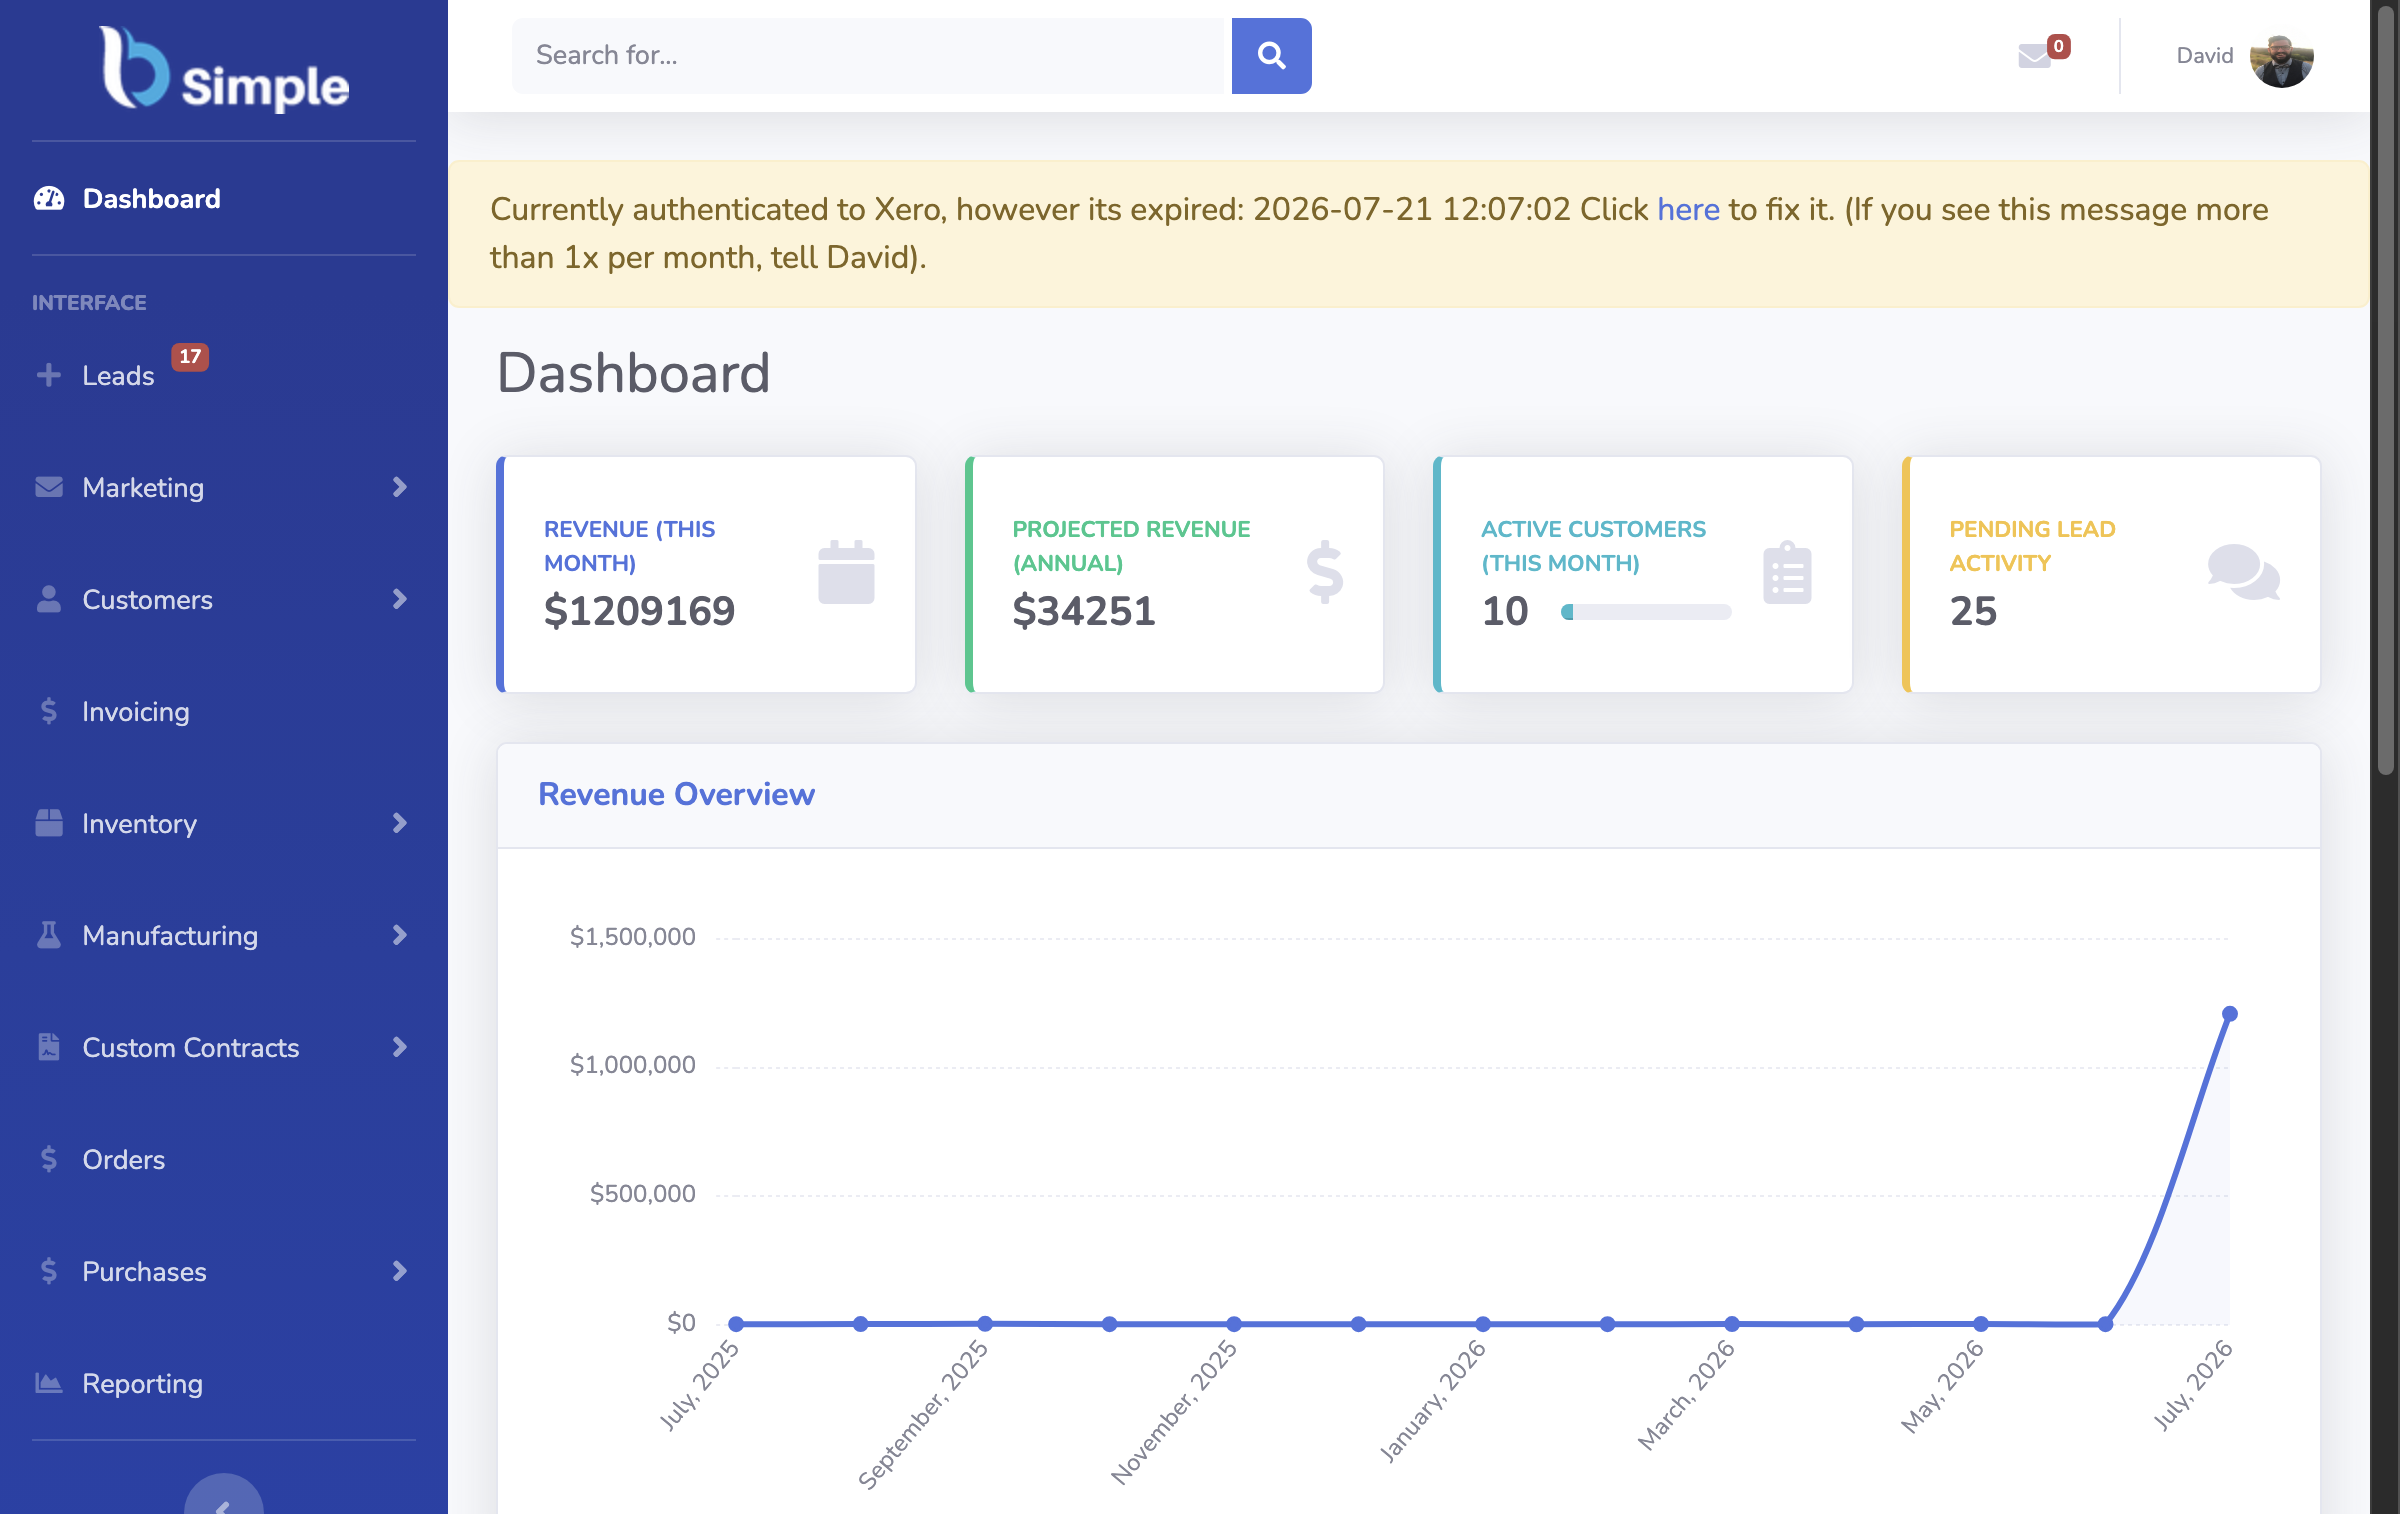
- The bridge: production systems expose data to analysis — BSimple's public REST API offers read projections (reorder levels, stocktakes, purchase orders) that an analysis workflow can consume.
- Where it fits: this page is one branch of the inventory management guide.
- 01The key facts
- 02What the search actually finds
- 03What is worth learning from the Kaggle route
- 04Building the real thing instead
What the search actually finds
Kaggle hosts supply-chain and retail datasets — transaction histories, stock levels, store-item demand series — plus notebooks where practitioners dissect them and occasional competitions on forecasting. For a student building an inventory analytics portfolio, or an analyst who wants practice on realistic demand data, it is a genuinely good gym. For a business looking for software to run its warehouse, it is a category error: no dataset records a delivery, no notebook raises a purchase order, and nothing on the platform carries an audit trail.
The two uses are complementary rather than competing. The operational system produces the history; the analysis studies it. Confusing the order of that sentence is how businesses end up with a forecasting model pointed at data nobody trusts.
What is worth learning from the Kaggle route
Clean data beats clever models. The first lesson every forecasting notebook teaches: the historical record decides everything. Gaps, drift and re-keyed numbers degrade any technique applied to them — which is an argument for an operational system that records movements as they happen, not for a better imputation trick.
Forecasting is probabilistic. Demand models produce ranges with error bars, not decisions. The reorder decision — how much to buy, when — belongs to the operational layer that can act: reorder levels, purchase orders, shortage checks. A forecast feeds that layer; it does not replace it.
The datasets teach the vocabulary. Turnover, carrying cost, service level, stockout impact — working through a supply-chain notebook builds the vocabulary a business needs to evaluate real software, and the example-driven guide grounds that vocabulary in actual order flows.
Building the real thing instead
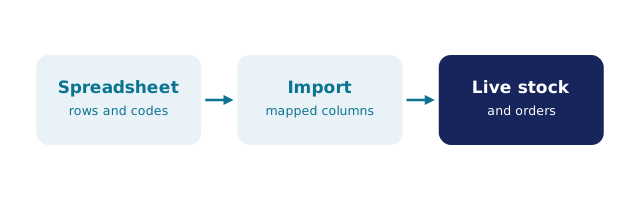
If the underlying goal is a working inventory system, the path runs through the record rather than the model: products, locations, append-only movements, derived quantities, reorder levels. The database-design walkthrough builds that schema in a sitting, and the build-vs-buy arithmetic prices the decision to stop at a prototype.
If the goal is analysis on top of a real system, look for an API rather than a dataset. BSimple exposes a public REST API with scoped keys — read projections for suppliers, locations, PAR levels, reorder points, stocktakes and purchase orders — so an analyst can point a notebook at the business's own true history instead of someone else's CSV, and the trial shows what that history looks like when the record keeps itself honest.
Frequently Asked Questions
Can I run my business inventory with Kaggle?
No. Kaggle hosts datasets and analysis notebooks; it does not record stock movements, orders or purchases, and nothing on it is queryable by a warehouse team mid-shift. Use it to learn analysis, and run stock on operational software.
Are the inventory datasets on Kaggle useful?
Yes, for practice: demand series, retail transactions and supply-chain records are exactly what a forecasting portfolio needs. They are someone else's history, though — models trained on them do not know your products, your lead times or your seasonality.
Can a demand-forecasting model replace reorder levels?
No. A forecast estimates future demand; it does not place purchase orders, check shortages or hold guardrails. The dependable pattern is an operational system with reorder levels that a forecast can inform — not the other way round.
Does BSimple connect to analysis tools?
Through its public REST API: scoped API keys and read projections for reorder levels, stocktakes, purchase orders, suppliers and locations. An analysis workflow can read the real record — the MCP endpoint additionally lets AI assistants query the same data.

BSimple