Complete Inventory Management System Er Diagram Solution Stop Guessing
Inventory Management System Er Diagram helps Australian wholesalers and manufacturers manage inventory, orders, and purchasing. Xero integration, customer po...
- Relational database design connecting products, stock levels, orders, suppliers, and customers seamlessly
- Automated purchase order generation based on stock thresholds, lead times, and customer demand forecasting
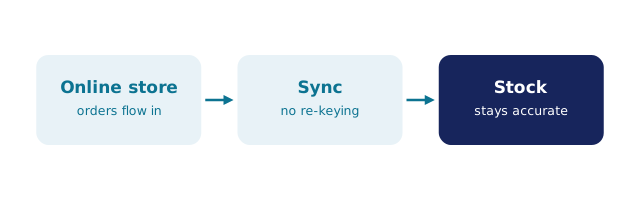
- Bidirectional Xero integration ensuring inventory changes automatically update financial records for GST compliance
- Negative inventory tracking enabling pre-orders and just-in-time manufacturing without manual calculations
- Multi-location stock management with intelligent order routing to nearest warehouse for cost optimisation
- Comprehensive transaction history and audit trails for EOFY stocktake reconciliation and compliance
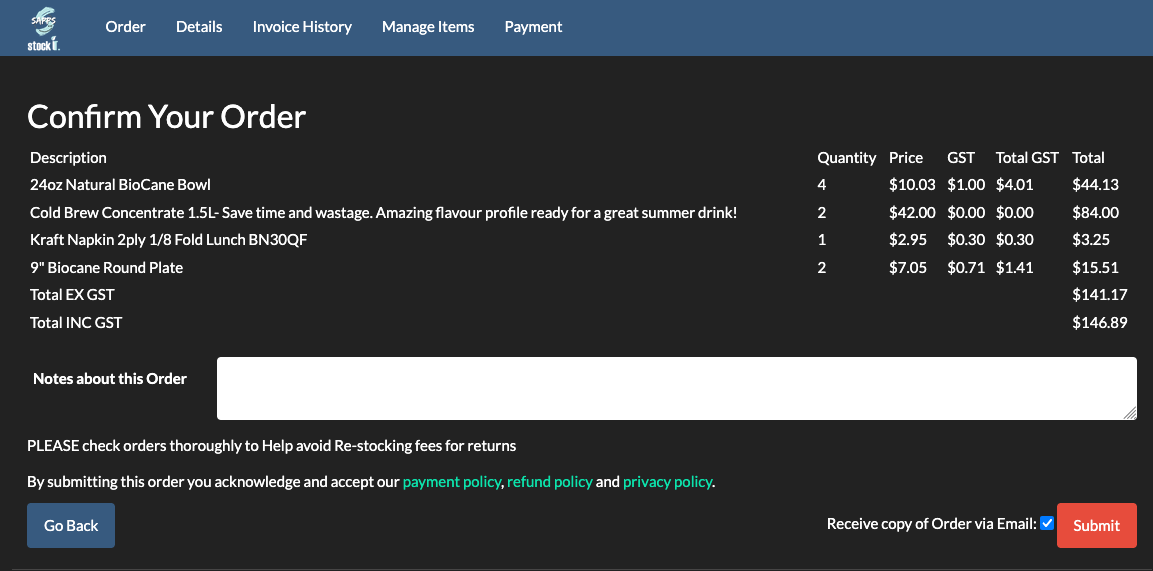
- Customer ordering portal integration allowing direct order placement with real-time stock availability visibility
Understanding an inventory management system ER diagram is essential for Australian wholesalers, manufacturers, and distributors looking to streamline operations — see also our Inventory Management Software for the full picture. An Entity-Relationship (ER) diagram serves as the blueprint for how your inventory data connects and flows through your business systems. Rather than guessing at how products, orders, suppliers, and stock levels should interact, a well-designed ER diagram maps out these relationships with precision, ensuring nothing falls through the cracks. For Australian SMBs managing complex supply chains, this isn't just theoretical IT stuff — it's the difference between knowing exactly where your stock is and discovering mid-EOFY that your records don't match reality. Whether you're a Sydney coffee roaster tracking bean inventory across multiple locations or a Melbourne brewery managing ingredient levels for seasonal production, the underlying data structure matters enormously. A proper ER diagram prevents the chaos of duplicate records, lost orders, and inventory discrepancies that plague businesses still relying on spreadsheets. It establishes clear relationships between customers, products, purchase orders, sales orders, and stock movements, creating a single source of truth for your entire operation. When integrated with accounting software like Xero, these relationships become even more powerful, automatically syncing inventory changes with financial records and eliminating manual data entry errors that cost time and money.
Understanding Your Inventory Data Structure
An inventory management system ER diagram typically includes several core entities that work together seamlessly. The Products entity stores information about what you sell — SKUs, descriptions, pricing, and supplier details. The Stock Levels entity tracks quantities on hand, reorder points, and warehouse locations. The Orders entity captures both customer sales orders and purchase orders from suppliers, linked to the Products entity so you know exactly what's being ordered. The Suppliers entity maintains vendor information, lead times, and minimum order quantities. The Customers entity stores ordering history and preferences, enabling features like customer ordering portals where clients can place orders directly. Then there's the Transactions or Stock Movements entity, which records every inventory change — receipts, sales, adjustments, and transfers between locations. These entities connect through primary and foreign keys, creating relationships that ensure data integrity. For example, when a customer places an order through your ordering portal, the system automatically references the Products entity to check stock availability, updates the Stock Levels entity to reflect the sale, and creates a record in the Transactions entity for audit purposes. This interconnected structure is precisely what BSimple implements, allowing Australian manufacturers and distributors to see their entire inventory picture in real time. Without this relational design, you'd have isolated data silos where stock information in one system doesn't match what's shown in another. The ER diagram approach eliminates this fragmentation, ensuring that when your warehouse team picks an item, when your accountant reconciles GST, and when your customer checks availability, everyone's working from the same accurate data.
Xero Integration and Financial Synchronisation
The real power of an inventory management system ER diagram emerges when you integrate it with Xero, Australia's leading accounting platform for SMBs. This integration creates bidirectional data flow — inventory changes automatically update your financial records, and accounting transactions update inventory accordingly. Imagine a Melbourne brewery that receives a shipment of bottles from a supplier. The ER diagram structure captures this receipt in the Stock Levels entity, simultaneously creating a bill in Xero for accounts payable. When you sell those bottles to a customer, the system decrements stock, records the sale in the Transactions entity, and generates an invoice in Xero. Your GST compliance becomes automatic because the system knows exactly when stock moved and at what value. This is particularly crucial for Australian businesses managing EOFY stocktakes, where manual reconciliation between inventory and accounting records can take weeks. With a properly designed ER diagram integrated with Xero, your stocktake is essentially pre-reconciled — physical counts just need to match what the system already knows. BSimple's approach to this integration means you're not manually re-entering data or managing conflicting records across systems. The ER diagram ensures that every entity is single-sourced and automatically synchronized. For distributors managing multiple warehouses or manufacturing facilities, this becomes invaluable. You might have stock in Sydney, Melbourne, and Brisbane, but the ER diagram structure means all locations report to a unified database. When a customer places an order, the system can automatically route it to the nearest warehouse with available stock, optimizing shipping costs and delivery times. This level of sophistication isn't possible with spreadsheets or disconnected systems — it requires a properly architected ER diagram that understands how every piece of your business connects.
Automated Ordering and Negative Stock Tracking
Negative inventory tracking and automated purchase order generation are two critical features that depend entirely on a solid ER diagram foundation. In traditional systems, when you sell more than you have in stock, chaos ensues. With a well-designed ER diagram, negative inventory is tracked deliberately and intelligently. Perhaps you're a Sydney coffee roaster with a customer who's ordered 500kg of beans, but you only have 300kg in stock. Rather than rejecting the order, the system records it in the Transactions entity as a negative stock movement. This triggers an automated purchase order generation rule — the ER diagram's relationships automatically calculate how much you need to reorder from your suppliers to fulfill both existing stock and pending orders. The system references your Suppliers entity to determine lead times and minimum order quantities, then generates a PO that accounts for just-in-time inventory principles. You're not manually calculating safety stock or wondering whether you should place an order — the ER diagram's logic handles it. This is where order management software becomes genuinely transformative for manufacturing and distribution. A brewery might use this feature to manage seasonal demand — when summer orders spike, the system automatically triggers larger purchase orders for ingredients, accounting for the supplier's lead time so stock arrives exactly when needed. The ER diagram ensures that these automated processes don't create duplicate orders or miss anything. Each entity has clear boundaries and relationships, so the logic that drives automation is transparent and auditable. When your accountant questions why a particular PO was generated, you can trace it back through the ER diagram's relationships to the specific demand signal that triggered it. This transparency builds confidence in your automated processes and reduces the risk of over-ordering or stock-outs that damage customer relationships.
Streamlined Stocktake and EOFY Compliance
Stocktake management becomes dramatically simpler when your inventory system is built on a solid ER diagram. Traditional stocktakes involve printing lists, walking the warehouse with clipboards, manually entering counts into spreadsheets, and then spending days reconciling discrepancies. With an ER diagram-based system, the process is fundamentally different. Your system maintains a continuous record of all stock movements in the Transactions entity, creating a theoretical inventory position. During stocktake, you're not starting from scratch — you're verifying and adjusting that position. The ER diagram's relationships mean that when you discover a variance (say, 10 units of a product are missing), the system can help you investigate. It can show you when those units were last received, which customer order they were allocated to, and whether they might have been damaged or misplaced. For Australian businesses managing EOFY compliance, this investigative capability is invaluable. Rather than simply writing off discrepancies, you can often identify root causes and prevent future occurrences. The ER diagram also enables cycle counting — instead of one massive annual stocktake, you count small sections regularly, spreading the effort throughout the year. The system tracks which areas have been counted recently, ensuring comprehensive coverage without disrupting daily operations. When you integrate this with Xero integration, your stocktake adjustments automatically flow through to your financial records. If you discover 50 units of inventory that weren't accounted for, the system records this adjustment, updates your asset values in Xero, and ensures your financial statements reflect reality. This level of accuracy is particularly important for manufacturers and distributors where inventory represents a significant portion of working capital. Lenders and accountants want to see that you know exactly what you have and that your records are reliable. An ER diagram-based system demonstrates this control, reducing audit friction and potentially improving your ability to secure favourable financing terms. For a closer look at how these capabilities fit together, our warehouse management software guide ties it all together, and the guide to related topics walks through the practical details.
Frequently Asked Questions
What exactly is an ER diagram in inventory management?
An Entity-Relationship diagram is a visual map showing how different data elements (entities) in your inventory system connect and relate to each other. It defines the structure that ensures accurate, consistent data flow across your entire business.
How does an ER diagram improve inventory accuracy?
By establishing clear relationships between products, stock levels, orders, and transactions, an ER diagram eliminates data silos and duplicates. Every change flows through defined pathways, ensuring all systems stay synchronized and accurate.
Why is ER diagram design important for Xero integration?
A well-designed ER diagram ensures seamless bidirectional data flow between your inventory system and Xero. Inventory changes automatically update your accounts, and accounting transactions update stock, eliminating manual re-entry and errors.
Can an ER diagram support multiple warehouse locations?
Yes, a properly designed ER diagram includes location entities that track stock across multiple warehouses. This enables automated routing of orders to the nearest warehouse and consolidated reporting across your entire distribution network.
How does an ER diagram enable automated purchase orders?
The ER diagram's relationships automatically calculate stock requirements based on customer orders, supplier lead times, and reorder points. When stock falls below thresholds, the system generates purchase orders without manual intervention.
What happens during EOFY stocktake with an ER diagram system?
Your system maintains a theoretical inventory position throughout the year. During stocktake, you verify this position rather than starting from scratch. Discrepancies are quickly identified and reconciled, with adjustments flowing directly to Xero for accurate financial reporting.
Is an ER diagram necessary for small Australian businesses?
Absolutely. Even small wholesalers and manufacturers benefit from ER diagram-based systems. They prevent the spreadsheet chaos that leads to lost orders, stock-outs, and GST compliance issues as your business grows.